
Looking to Sell?
Contact
805 Main Street | Morro Bay, CA 93442[email protected]San Luis Obispo County June 2023 Market Update
Locally sourced, real data is key when you are thinking of buying or selling a home, or even if you just like to stay up to date on the real estate market.
Knowing the most important data such as the average sales price, number of homes sold, and days on market will better prepare you to sell your home.
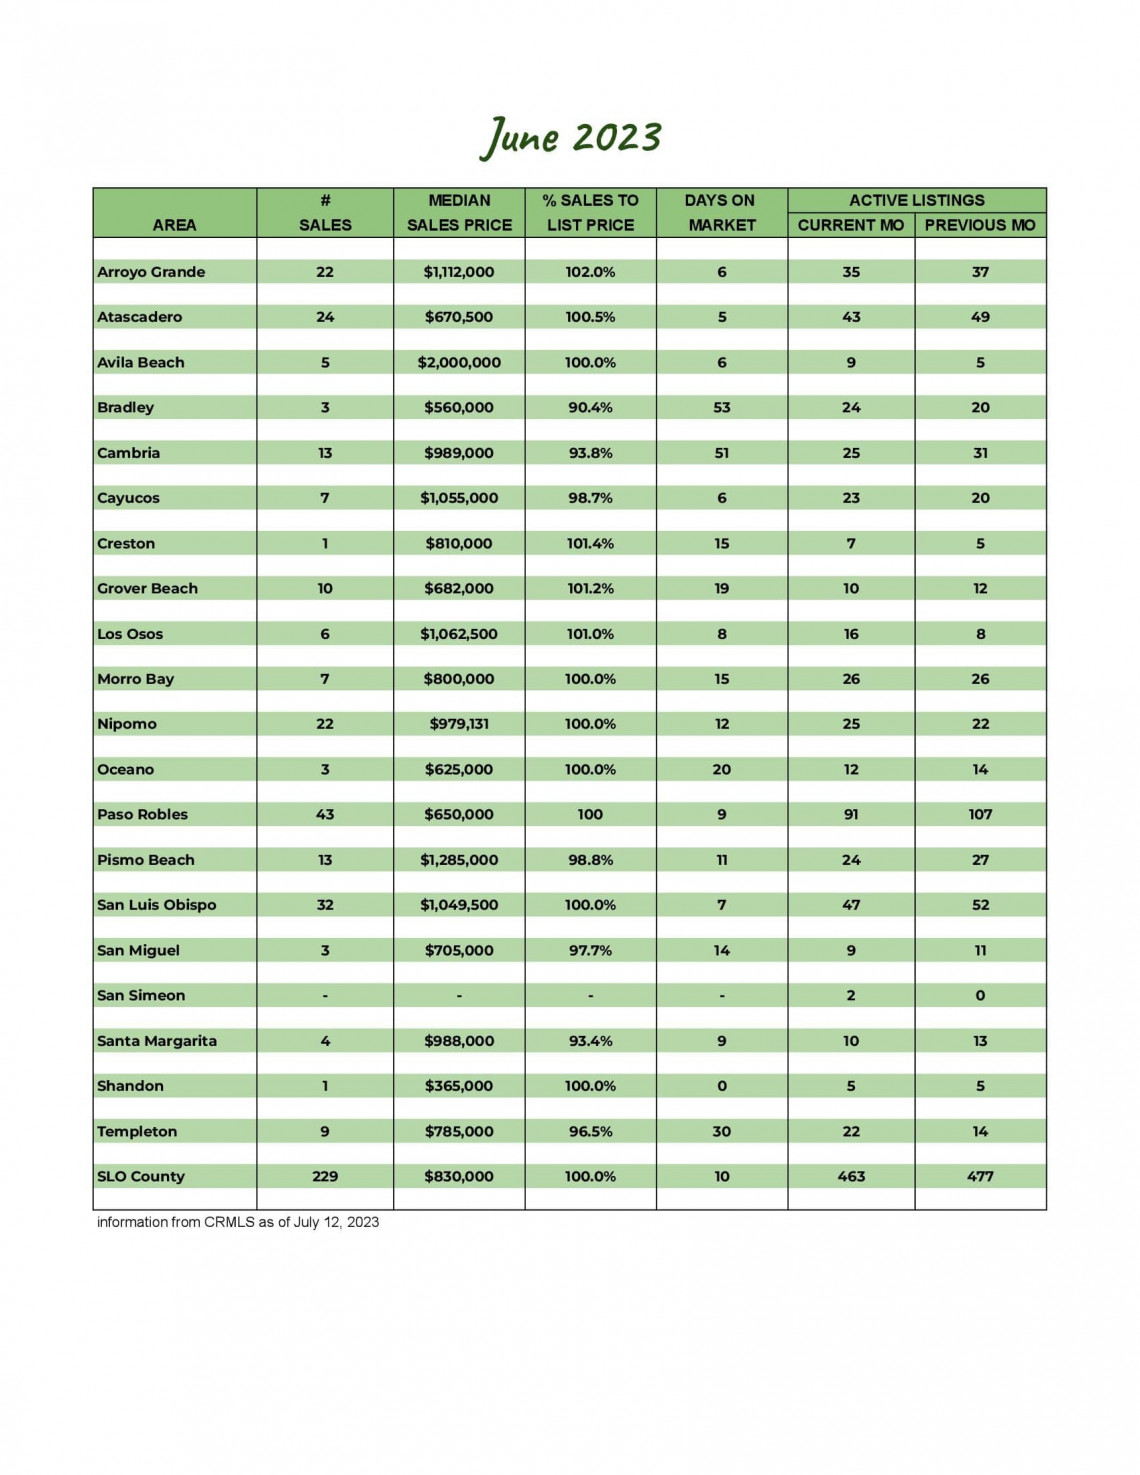
While the June median sales price saw no change from last month it is down 2.4% from June of last year. The number of new listings held the same, pending sales were up, and closed sales saw a decrease from last month, leaving active inventory unchanged. The average days on the market was up a few days from last month, and the average percentage of the sales price to list price dipped to 98.8%.
Our market report showcases everything you need to know about each San Luis Obispo County community's real estate trends.
267
New Listings
2022: 401
463
Active Listings
2022: 657
211
Under Contract
2022: 245
229
Closed Sales
2022: 296
Homes Sold
98.8%
Sale-to-List Price
2022: 101.4%

$1,005,197
Avg Sales Price
2022: $1,009,873

2.2
Months of Supply
2022: 2.3

30
Avg Days on Market
2022: 19

$554
Avg Price per Sq Foot
2022: $563