

Looking to Sell?
Contact
805 Main Street | Morro Bay, CA 93442[email protected]San Luis Obispo County Market Report
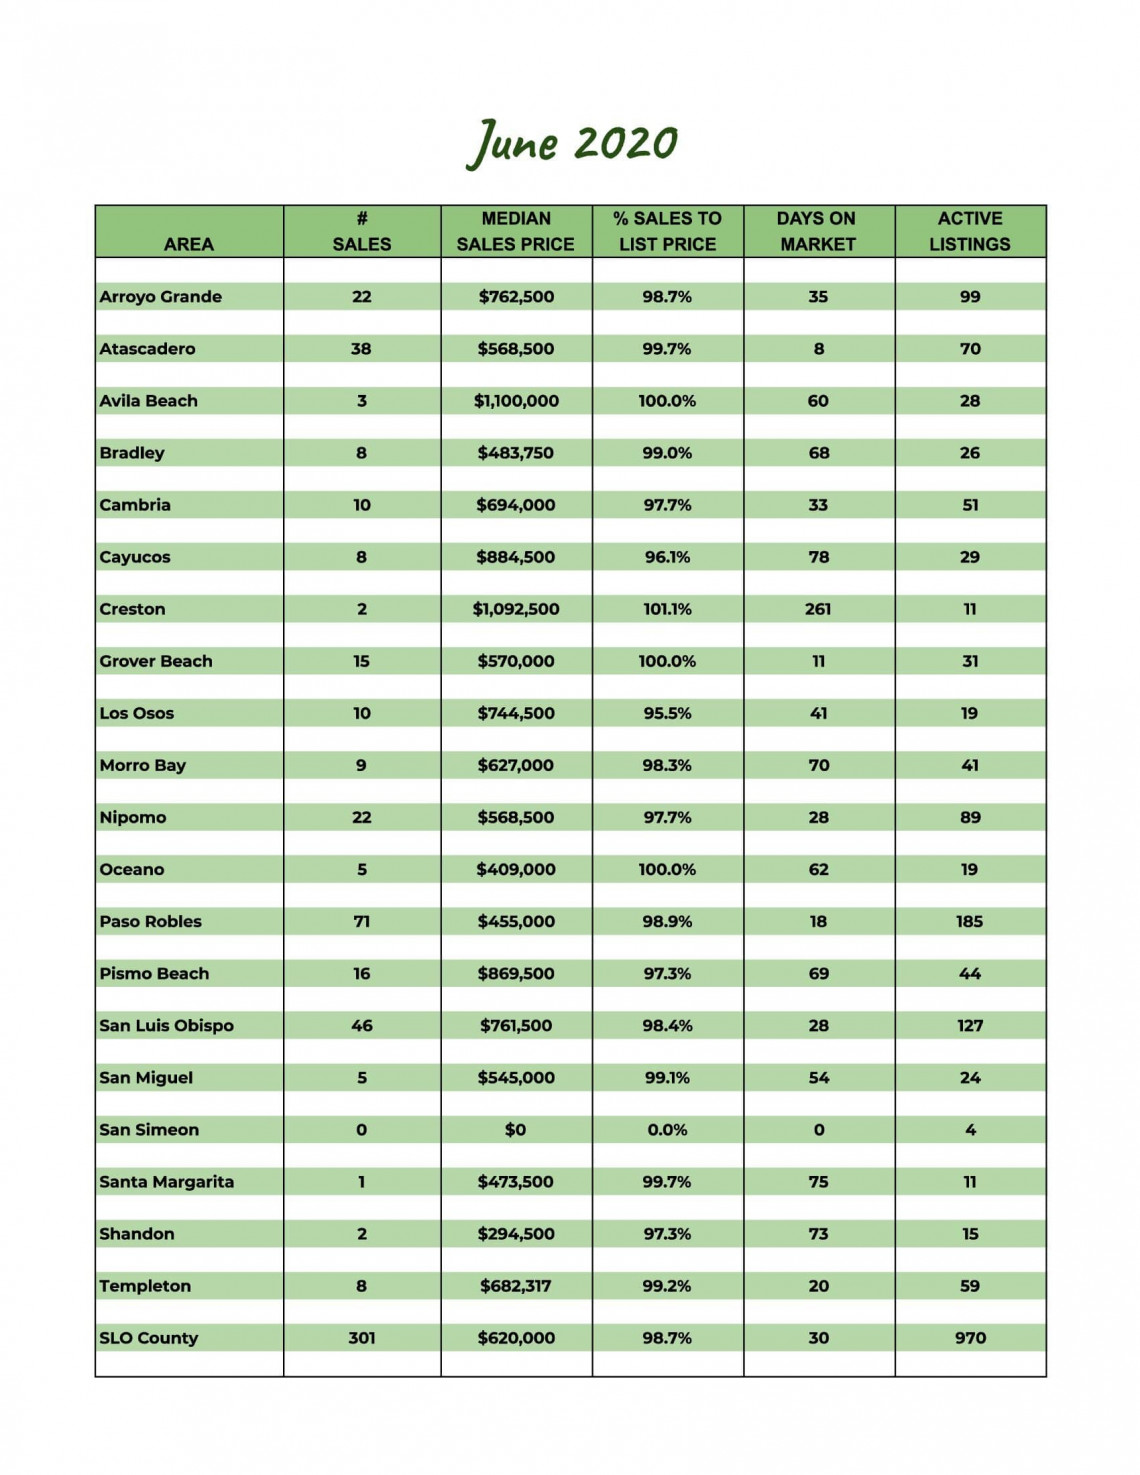
June 2020
If you’re thinking about selling your home, it's important to have a good understanding of what’s going on in the San Luis Obispo area market.
Knowing the most important data such as the average sales price, number of homes sold, and days on market will better prepare you to sell your home.
Our market report showcases everything you need to know about local real estate trends. Scroll down for area specific information.
379
New Listings
929
Active Listings
336
Under Contract
301
Closed Sales
$699,488
Average Sales Price
57
Average Days on Market
$400
Average Price Per Square Foot
3.3
Months of Supply
Homes Sold
98.0%
Sale-to-List Price