
Looking to Sell?
Contact
805 Main Street | Morro Bay, CA 93442[email protected]San Luis Obispo County October 2023 Market Update
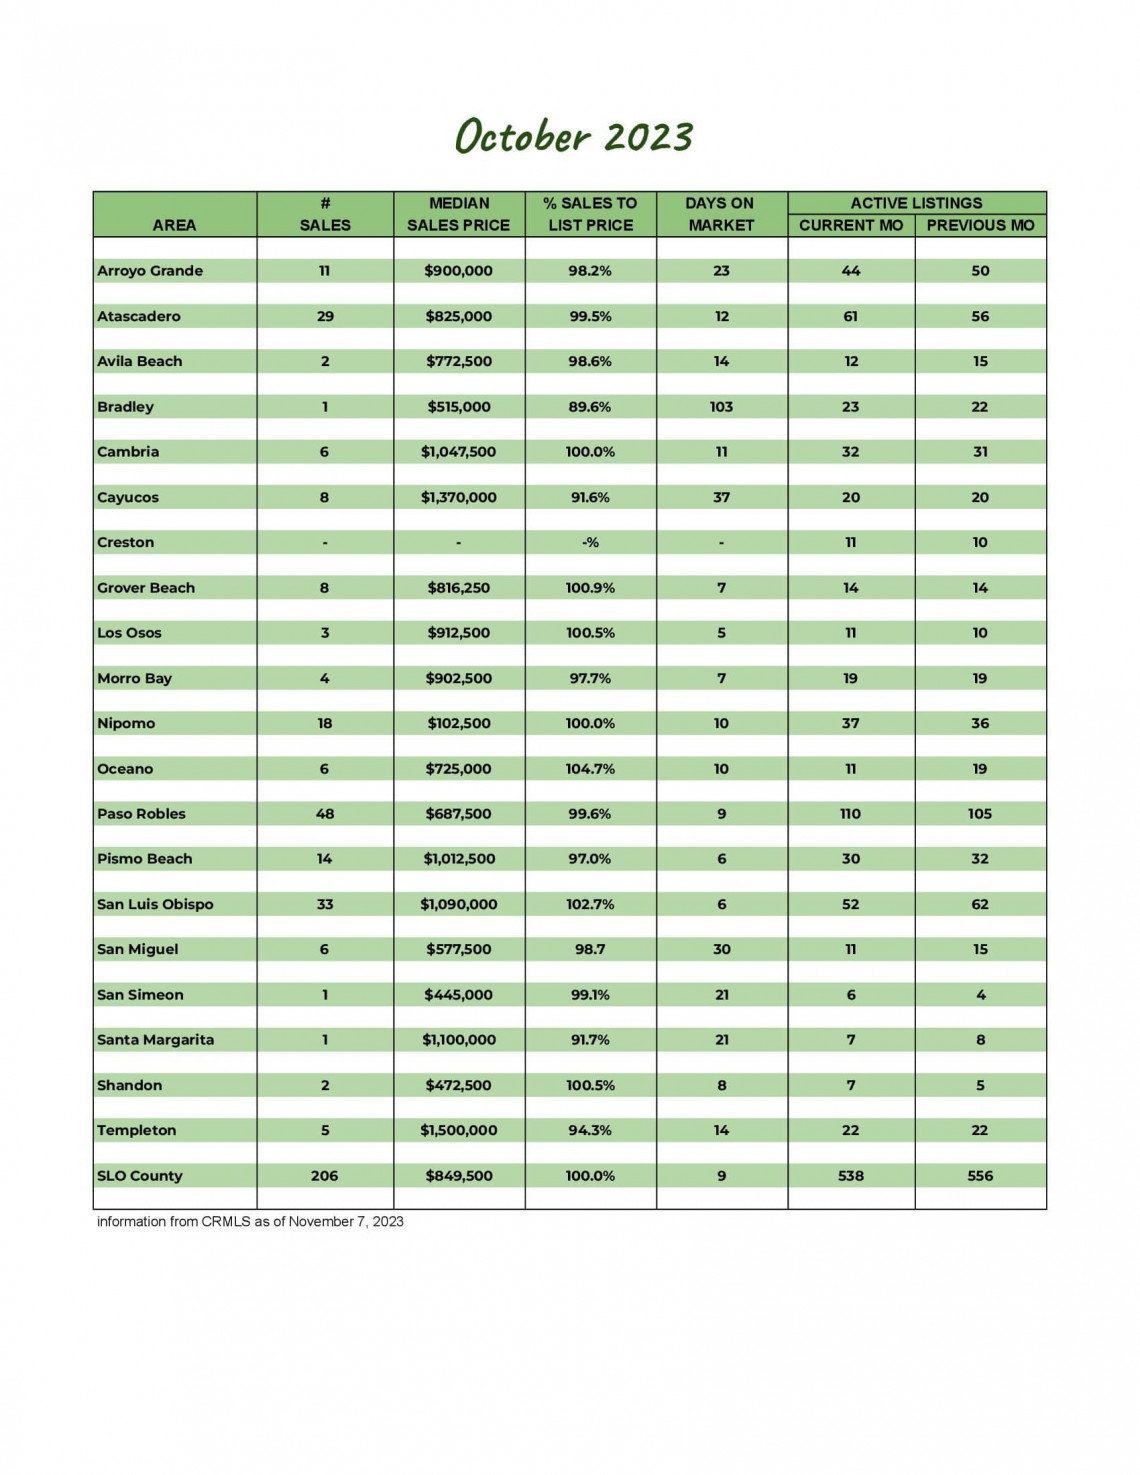
Whether you're thinking of buying or selling a home, or just like to stay up to date on the real estate market, you need locally sourced, real data to keep you informed.
Knowing the most important data such as the average sales price, number of homes sold, and days on market will better prepare you for your real estate transaction.
There are very few differences in the stats from October 2022 and October 2023. The most notable is the average sales price is up 5.5% from last year.
The average percentage of the sales price to list price is up to 98.3%, slightly over half of the homes sold for the list price or above.
Our market report showcases everything you need to know about each San Luis Obispo County community's real estate trends.
222
New Listings
2022: 239
538
Active Listings
2022: 643
165
Under Contract
2022: 185
206
Closed Sales
2022: 210
Homes Sold
98.3%
Sale-to-List Price
2022: 96.3%

$966,902
Avg Sales Price
2022: $916,579

2.7
Months of Supply
2022: 2.6

28
Avg Days on Market
2022: 33

$558
Avg Price per Sq Foot
2022: $506